top of page

Qualitative and Quantitative Research
Sample Projects

Point in Time
Data distribution at a given point in time. Waterfall chart created with Excel.

Change Over Time
Data distribution as it changes from a given point in time. Created with Excel's Pivot Charting feature.

Customer Experience
Proof of concept for a survey capturing sponsorship experiences. Created with Google Docs.
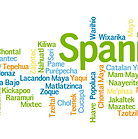
Languages
Word Clouds representing the languages spoken in the 25 countries where ChildFund works, with relative weight given to the language frequency. Created with Wordle.
bottom of page